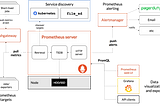
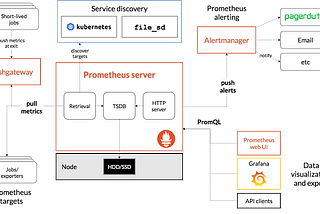
Radheya ZunjurDay 79 — PrometheusNow, the next step is to learn about the Prometheus. It’s an open-source system for monitoring services and alerts based on a time series…5 min read·Nov 2, 2023----
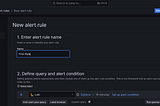
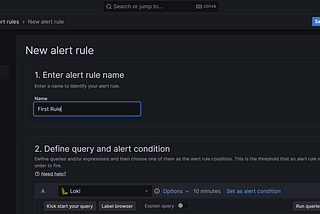
Radheya ZunjurDay 77 AlertingGrafana Alerting allows you to learn about problems in your systems moments after they occur. Create, manage, and take action on your…2 min read·Nov 1, 2023----
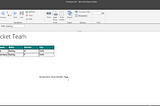
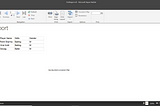
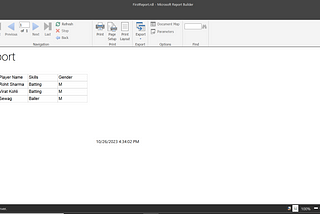
Radheya ZunjurSSRS — Part 2In the last article we created simple SSRS Report. Today we will dive deeper into making our reports more interesting. We will see how…4 min read·Oct 30, 2023----
Radheya ZunjurSSRS(Tutorial)- Learn SSRS Step By StepThis SSRS tutorial serves as a comprehensive roadmap, guiding you through the intricate landscape of data visualization and reporting. From…5 min read·Oct 30, 2023----
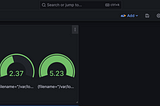
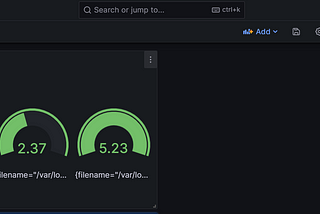
Radheya ZunjurDay 76 Build a Grafana dashboardA dashboard gives you an at-a-glance view of your data and lets you track metrics through different visualizations.2 min read·Oct 23, 2023----
Radheya ZunjurDay 75 — Sending Docker Log to GrafanaDay 75 of our 90-day journey marks a pivotal moment in our quest to optimize Docker logging by integrating Grafana, a powerful open-source…7 min read·Oct 23, 2023----
Radheya ZunjurDay 74 — Connecting EC2 with GrafanaOn this 74th day of our 90-day journey, we delve into the intricacies of connecting Amazon EC2 instances with Grafana, exploring the…5 min read·Oct 17, 2023----
Radheya ZunjurDay 73 — Setting up GrafanaAs we delve into the 73rd day of our 90-day journey, this installment focuses on the crucial process of setting up Grafana, a pivotal step…2 min read·Oct 17, 2023----
Radheya ZunjurDay 72 — GrafanaAs we step into the 72nd day of our exploration into essential technologies, we embark on a comprehensive introduction to Grafana…6 min read·Oct 17, 2023----